Summary
See the value of steps in the portfolio construction process.
Description
Fund management involves a number of decisions. It is possible to see the effect that at least some of these decisions have had in the past.
One decomposition would be into bets on risk factors, and bets on individual assets given the risk bets. This decomposition could lead to three return distributions:
- a distribution for suitably sized bets on risk factors.
- a distribution given the desired bets on the risk factors.
- a distribution given the desired bets on the risk factors with the preferred assets overweighted.
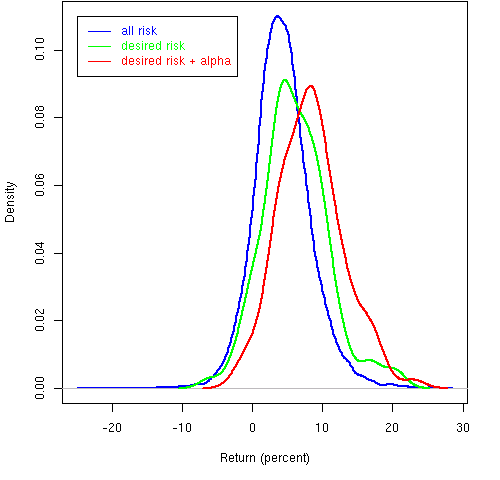
Figure 1: Returns under three sets of constraints

Figure 1 shows an example. The blue line is the distribution of returns over a given time period of portfolios that have a number of bets on risk factors that we might have taken. The green line shows the distribution of returns for portfolios that have the risk bets that we wanted to take for the period. The red line shows the returns for the desired bets plus the use of our expected returns of the assets.
This is showing an example where we’ve done well — the mean of the distribution of the desired risk bets is about 2% better than the mean of the distribution containing all of the bets. Also our constraint on expected returns adds roughly another 2%.
The analysis merely generates a series of sets of random portfolios with some constraints always the same and other constraints varying.
This is really a form of performance attribution but a non-traditional form.
