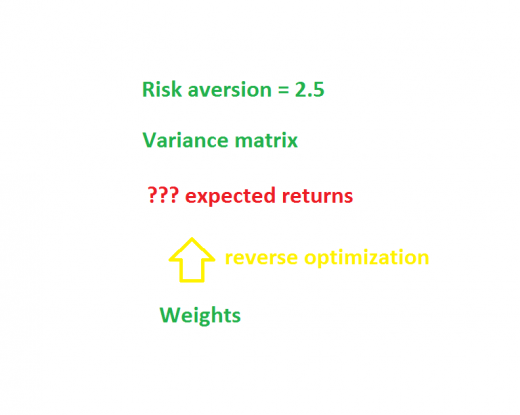
We have a portfolio with weights A=20%, B=60%, C=20%. That we have this particular portfolio is really a market prediction. What are the returns that the portfolio is “expecting”?
In technical terms, we want the implied alpha of the portfolio (found via reverse optimization). We’ll explore this in a mostly pictorial fashion. Eventually we do break into full sentences. Finally we peer over the precipice.
But first, optimization
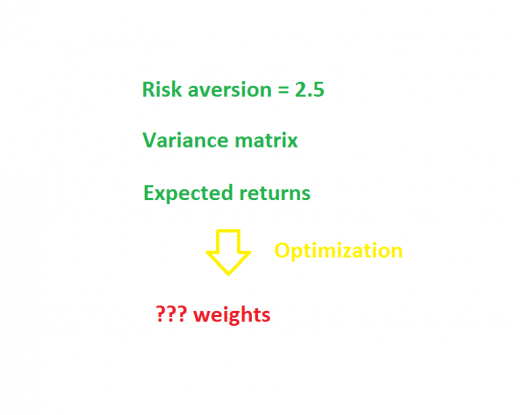
Optimization discovers the “best” weight for each of the assets, given the variance and expected returns.
Let’s do a specific example.
Our risk aversion is 2.5.
We have three assets with expected returns of A: 10.3% B: -4.7% C: 2.1%
Here is our variance matrix:
| A | B | C | |
| A | 3600 | 120 | 960 |
| B | 120 | 400 | 160 |
| C | 960 | 160 | 1600 |
The correlations embedded in this variance matrix are: A and B: 0.1, A and C: 0.4, B and C: .2.
It turns out that the optimal portfolio in this case has weights: A=4.2%, B=84.1%, C=11.7%.
In reality
 In reality what we know is the weights of our existing portfolio. To a reasonable approximation we know the variance matrix (see What the hell is a variance matrix?). Reverse optimization gives us expected returns (that is, the implied alphas).
For our specific problem with weights A=20%, B=60%, C=20% we get implied alphas of: A=49.2%, B=14.8%, C=30.4%.
What good is it?
It is hard to create specific numbers for expected returns even if we have a sense of what we believe about expected returns.
We can see if the ordering of the implied alphas reasonably corresponds to our beliefs about future returns of the assets. If not, then maybe we should change the portfolio.
Some Detail
The reverse optimization process results from a trivial derivation. Trivial, that is, if you know multivariate calculus.
The actual numbers of the implied alphas are not especially meaningful. If you change your risk aversion, that just scales the implied alphas up or down. When you do mean-variance optimization, you can add the same number to all of the expected returns and still get the same answer. This means you can add the same number to all of the implied alphas.
We can subtract 30% from each of the implied alphas from our example and get: A=19.2%, B=-15.2%, C=0.4%.
It is the ordering of the implied alphas that is important.
Less trivial
It is not so trivial to reverse engineer maximizing the information ratio — the mean-variance problem yields wonderful simplicity.
Another assumption the trivial solution makes is that there are no constraints. There are constraints. Well, maybe there is some actual portfolio somewhere without constraints, but any portfolio I’ve ever heard of has constraints.
Constraints make a difference.
An easy way to see that constraints matter is to think of a long-only portfolio that does not hold all of the assets in the universe. What is the portfolio saying about the assets it doesn’t hold?
Turnover constraints are likely to have an effect. Views on assets may change much faster than turnover allows changes in the portfolio. So we shouldn’t be surprised if the portfolio reflects past views more than current views.
Opinions on the usefulness of implied alpha range from “moderately interesting” to “should be standard procedure”. That wide gap is a symptom of the fact that none of us knows all that much about it.
Update (2013 May 20): A post with further explanation is “Implied alpha and minimum variance”.
(Photo from istockphoto.com)


Great post Patrick. Love the graphics.
Patrick,
I maybe wrong, but in the example above the impled alphas correspond to a risk aversion of λ=5, rather than 2.5, if you are using λΣw.
Is it correct to say the risk-free rate here is zero, and the optimized portfolio weights are from the minimum variance set?
Jeff,
Thanks. You are both right and wrong (I believe). Many people think mean-variance utility is:
expected.return – risk.aversion / 2 * portfolio.variance
Portfolio Probe and others think mean-variance is:
expected.return – risk.aversion * portfolio.variance
The reason the two comes into it is precisely because of the sort of computation that gives us the implied alphas.
Maybe I’m wrong but I think that you can think of the risk-free rate as zero, as us dealing with excess returns (excess over risk-free rate), or as not caring about risk-free rates.
The question about minimum variance has me stumped. I’ll need to think about minimum variance and implied alpha.
Patrick,
I checked with my optimizer and confirm that weights: A=4.2%, B=84.1%, C=11.7% are within rouding error of the minimum variance optimal portofolio weights for the covariance matrix in the example.
Yes, that is because the variance and expected returns are in percent, but the risk aversion is on a scale that makes sense for values in their natural scale. The risk aversion should be divided by 100 to put it into a region where it moves away from minimum variance.
So I should have used risk aversion 0.025.
Pingback: The top 7 portfolio optimization problems | Portfolio Probe | Generate random portfolios. Fund management software by Burns Statistics
Only they understand what plans they have got in their eyes and that’s how to pick
a hosting that suits them. You get a several tools, resources and scripts, and
can enable you to provide better intend to your clients.
With cloud website hosting, it is practical for that
you harness the effectiveness of multiple servers across a quantity of locations so that you can access the highest level of computing
power and uptime possible.
Mon fils est un cloud manager,pourtant,avec mes pc je prends le temps de les faire tourner et je n’aime pas l’inconnu .