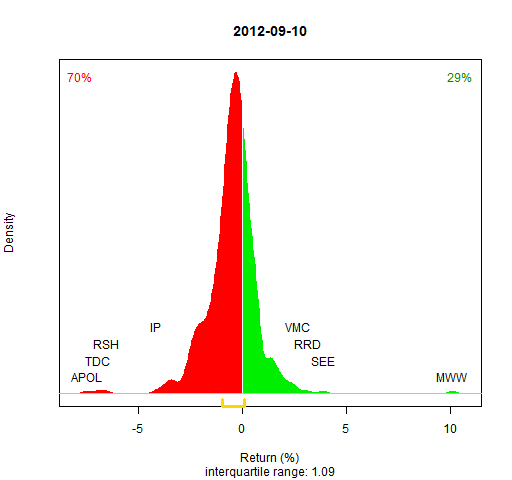
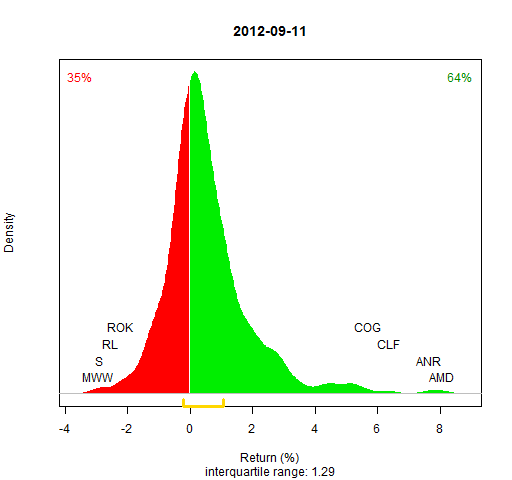
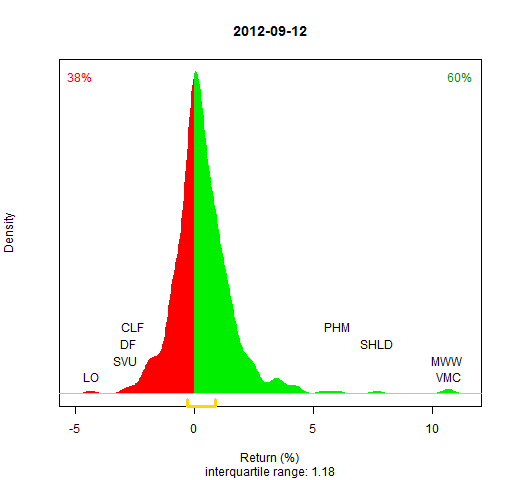
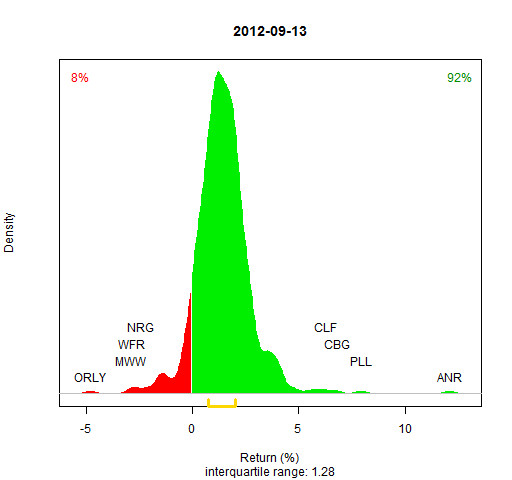
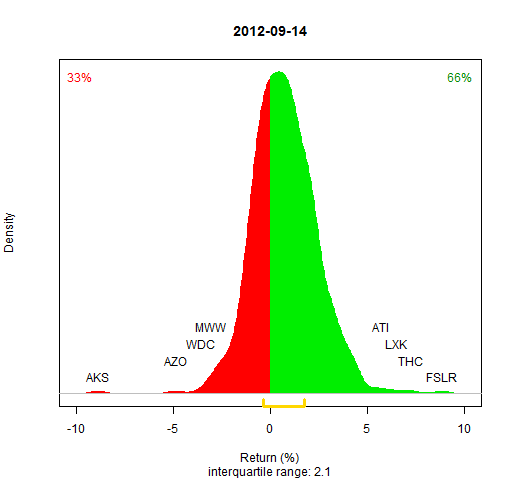
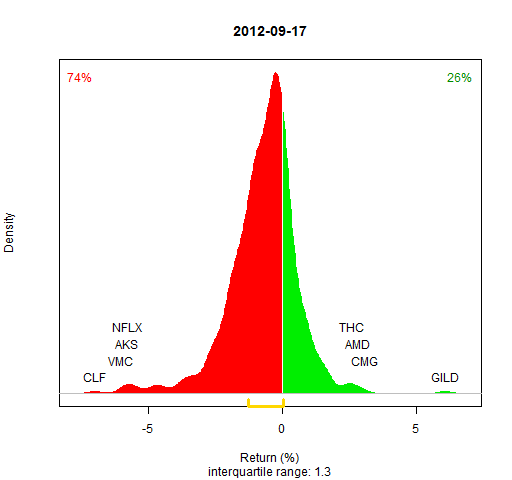
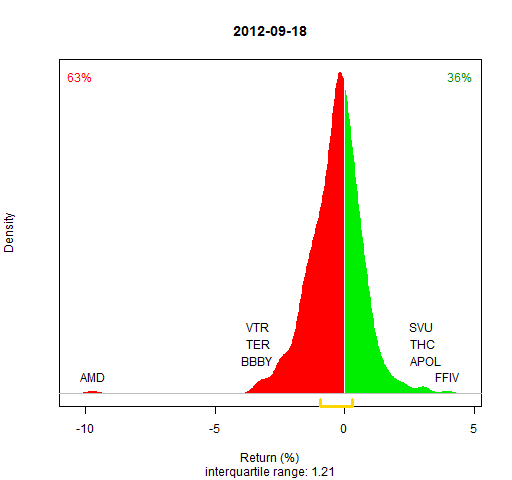
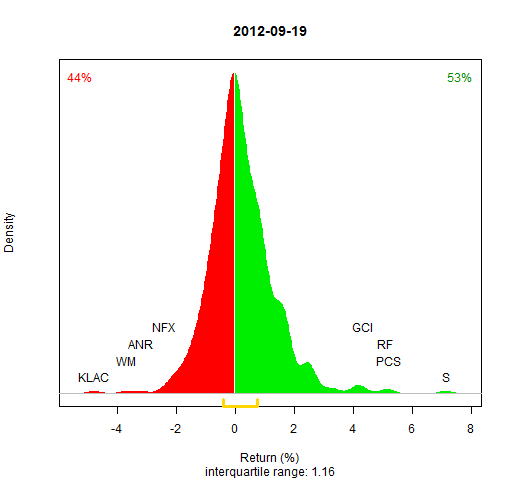
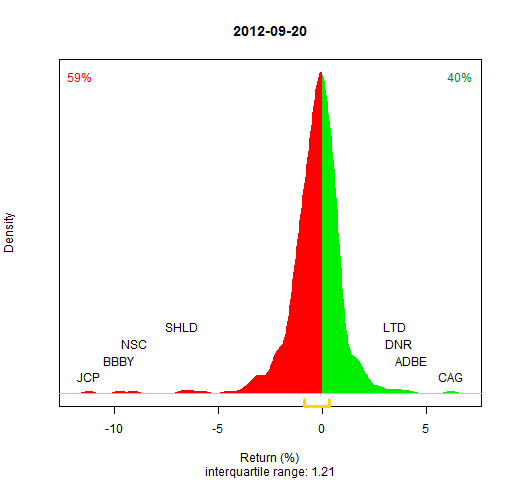
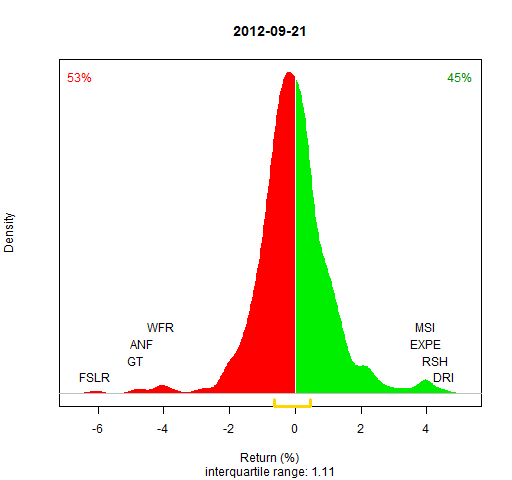
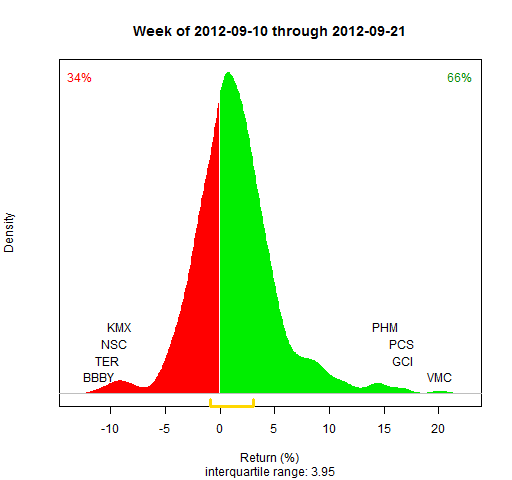
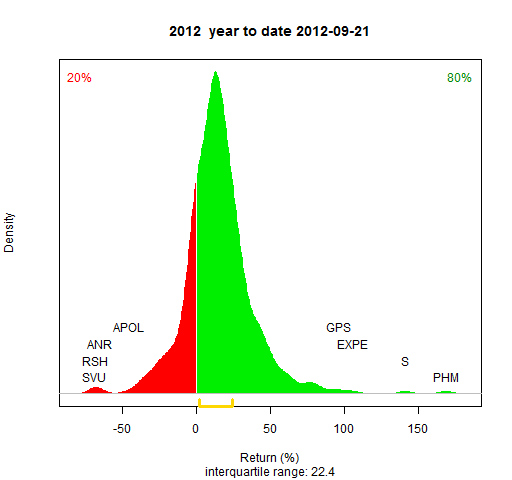
US large cap market returns.
 Notice
The week plot this time is for quite a long “week”.
Last week there were problems downloading the data. There were still some this week, but the R code has been updated to be more useful in this event (it is no longer necessary to get all the data downloaded in one go).
Fine print
- The data are from Yahoo
- Almost all of the S&P 500 stocks are used
- The initial post was “Replacing market indices”
- The R code is in marketportrait_funs.R
