The minimum variance portfolios have slightly reduced correlations to assets in weight-constrained portfolios.
Previously
“Portfolio diversity” introduced the topic of asset-portfolio correlations. It also generated four sets of long-only random portfolios as of the start of 2011 using constituents of the S&P 500:
- exactly 20 names, weights between 1% and 10%
- exactly 200 names, weights between 0.1% and 1%
- exactly 20 names, maximum asset-portfolio correlation of 60%
- exactly 200 names, maximum asset-portfolio correlation of 60%
Here we see what the asset correlations with the respective minimum variance portfolios look like.
Asset correlations
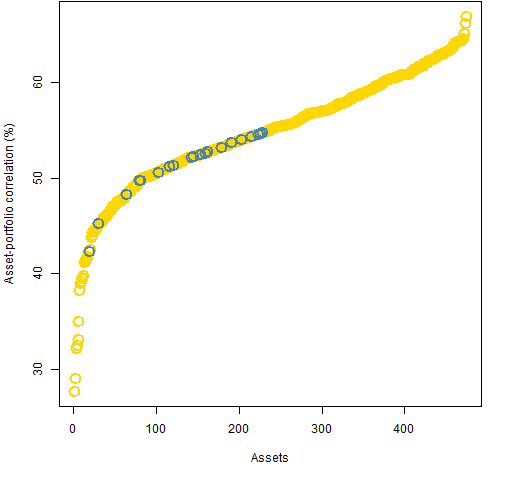
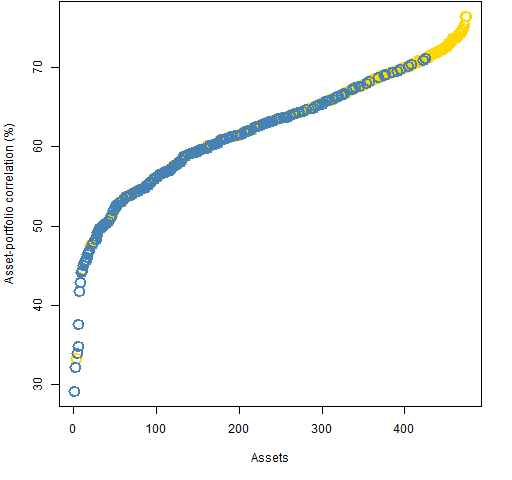
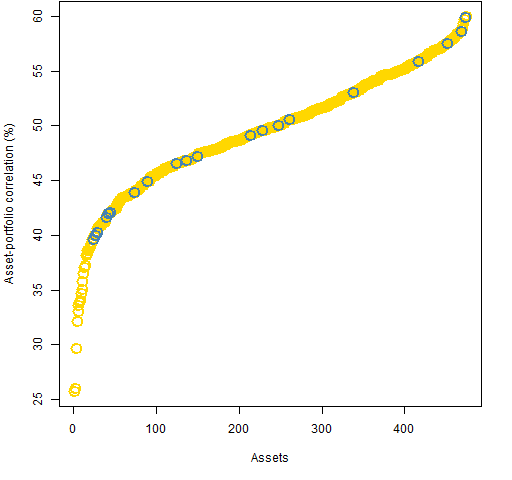
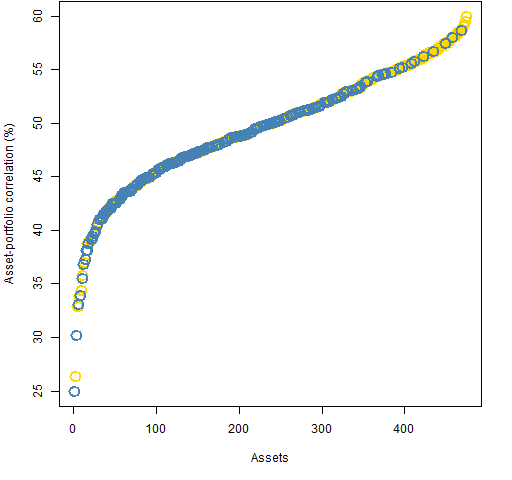
Figures 1 through 4 show the asset-portfolio correlation distribution for the minimum variance portfolio with each set of constraints.
Figure 1: Asset-portfolio correlations in the 20-name minimum variance portfolio with weight constraints — blue are in the portfolio, gold are outside the portfolio. 
The maximum correlation in Figure 1 is 66.9% and the maximum in Figure 2 is 76.5%.
Figure 2: Asset-portfolio correlations in the 200-name minimum variance portfolio with weight constraints — blue are in the portfolio, gold are outside the portfolio. 
Figure 3: Asset-portfolio correlations in the 20-name minimum variance portfolio with correlation constraints — blue are in the portfolio, gold are outside the portfolio. 
Figure 4: Asset-portfolio correlations in the 200-name minimum variance portfolio with correlation constraints — blue are in the portfolio, gold are outside the portfolio. 
Summary
The asset-portfolio correlation distributions for the minimum variance portfolios don’t seem to be too different from those of typical portfolios (shown in “Portfolio diversity”). The correlations are somewhat smaller for the minimum variance weight constraint portfolios, and somewhat larger for the correlation constraint portfolios.
Appendix R
The following commands need the Portfolio Probe software.
> require(PortfolioProbe)
get minimum variance portfolios
> divop.200w <- trade.optimizer(sp5.price10, sp5.var10,
+    long.only=TRUE, gross=1e7, max.weight=.01,
+    threshold=1e7 * .001/sp5.price10,
+    port.size=c(200,200))
The command as written here will produce a warning about switching from the default utility of maximizing the information ratio. In production code it is better to avoid such warnings by specifying the utility or suppressing that particular warning.
add asset-portfolio correlations
In this case where the asset-portfolio correlations are not part of the problem, we need to compute them. An easy way to do this is to evaluate the optimization problem at its solution with correlations added as a constraint:
> divop.200wc <- update(divop.200w, risk.fraction=1,
+    rf.style='corport', start.sol=divop.200w, funev=0)
The funev=0 is saying to limit the maximum number of function evaluations to zero. It takes the liberty of performing one function evaluation — with the answer given by start.sol.
use correlations
The correlations are in the risk.fraction component of the new object. An example of their use is:
> max(divop.200wc$risk.fraction)
[1] 0.7648725
> which.max(divop.200wc$risk.fraction)
[1] 332
> rownames(divop.200wc$risk.fraction)[332]
[1] "PCAR"

Very interesting stuff, Pat! The asset correlation constraint is certainly a clever and novel approach to targeting a minimum level of diversification. I’ve recently been experimenting with minimum correlation portfolios as a way of determining how much diversification potential exists within a universe of assets — they tend to be similar to minimum variance portfolios, but I’ve found them to be a useful summary measure regarding the diversification properties of correlation matrices.
How do you feel about all the recent attention being paid to MVPs and risk parity as useful investment strategies? It seems like a fad to me, but some of the research that’s been done, including yours here, is pretty compelling…
Randy,
Thanks for your comments. So if I understand you properly, you do an optimization to get minimum variance except you give the optimizer a correlation matrix instead of a variance matrix. The advantage there is that any old optimizer will do.
Some people have objections to minimum variance portfolios that I don’t fully understand — perhaps they are right. I, in general, I am supportive of minimum variance (until persuaded otherwise). However, 2011 was a great year for minimum variance (at least for S&P 500 stocks), so I think there is probably a bit too much enthusiasm for it at the moment.
As for risk parity, I don’t see why I (or anyone) should want equality. But I think that risk parity is a great tool to spread the idea of constraining risk rather than weight. When people constrain weights, they think they are constraining risk — that is because the technology to do what people wanted didn’t used to exist.
Hi again! Yes, MVP using a correlation matrix instead of a full covariance matrix — it’s a convenient way of separating out the pure diversification aspects associated with correlations.
Bernd Scherer and others have done some work on MVP investing and shown that the portfolios have high exposure to low-vol factors (value, low beta, etc.). Seems to me recent MVP performance might be reflecting factor or style rotation, although I haven’t really looked into it.
I agree with you that risk parity has been helpful in getting investors to think about constraining risk versus portfolio weights. You’ve done some significant work on this, correct?
Randy,
I’ve done some work on constraining risk rather than weight (like “Weight compared to risk fraction”). It is not for me to say if it is significant.
Nicely done, Patrick. Regarding the balancing of risk, I think in the case of a committee overseeing a portfolio managed by others there is not necessarily a crisp “view” that can be expressed. Or if it can, the ability to tactically trade that view is diminished. So from an asset allocation perspective, balancing out risks – rather than asset exposures – has a lot of appeal.
In some sense, though, one is just trading one problem for another, as both defining what is meant by “risks” and gaining exposure to them can be just as problematic as having a view as to whether stocks are going to outperform bonds, large cap will outperform small cap, etc.
Pingback: Popular posts 2012 May | Portfolio Probe | Generate random portfolios. Fund management software by Burns Statistics