Be careful if you have global daily data.
The issue
Markets around the world are open at different times. November 21 for the Tokyo stock market is different from November 21 for the London stock market. The New York stock market has yet a different November 21.
The effect
The major effect is that correlations appear to be too small. The returns of two Japanese stocks are based on the same time periods each day, so news that affects both of them affects them on the same day in the data. A piece of news that affects both a Japanese stock and a French stock may affect them on different days — they are moving together but apparently not at the same time.
Building a variance matrix with asynchronous data will have too small of correlations. This means, for instance, that the diversification of portfolios will look too good.
Solutions
Use weekly data
The easiest solution is to move to a lower frequency. No matter what frequency you use, there will be some asynchrony. Weekly, though, seems to be a long enough period — the asynchrony effect is quite dilute.
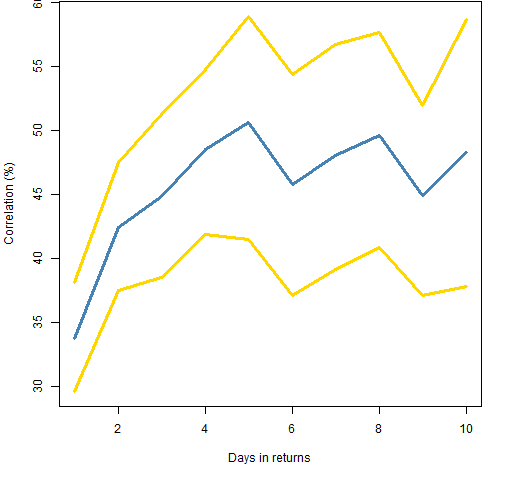
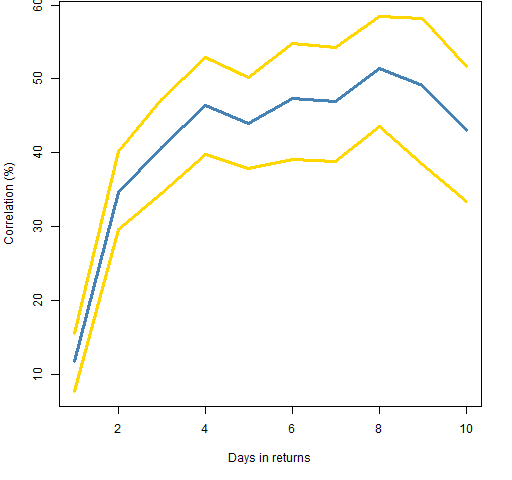
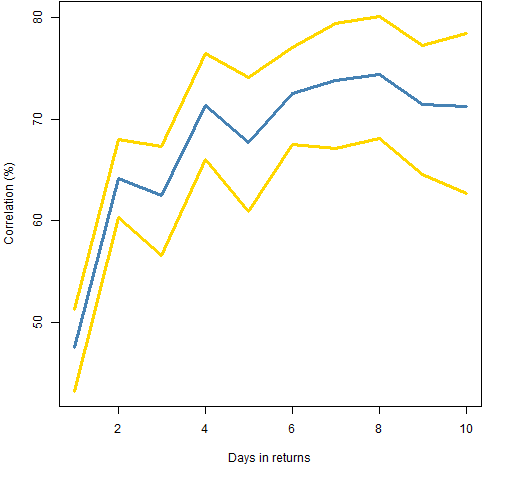
Figures 1 through 3 show the effect of aggregating days on the estimation of correlation in asynchronous data. The gold lines are 95% bootstrap confidence intervals for the estimates.
Figure 1: Correlation estimates (blue) with 95% confidence intervals (gold) between the Nikkei 225 and the FTSE 100. 
Figure 2: Correlation estimates (blue) with 95% confidence intervals (gold) between the Nikkei 225 and the S&P 500. 
Figure 3: Correlation estimates (blue) with 95% confidence intervals (gold) between the FTSE 100 and the S&P 500. 
Use an MA model
A more sophisticated way of handling asynchrony is to model what is happening in the data. It turns out that the natural model is a multivariate MA(1). The paper “Correlations and Volatilites of Asynchronous Data” by Burns, Engle and Mezrich explains that result. Here is the gated published version and the working paper version.
The paper uses a multivariate garch model but the moving average estimate is quite robust to garch effects — a regular multivariate moving average estimate would do.
Stale prices
Another type of asynchronous data is that of illiquid assets. If the last time an asset was traded was noon, then the closing price will not incorporate the news that occurred during the afternoon. Some modeling can be done to try to estimate the “real” closing price, but I find it hard to believe that a model could be very good.
Epilogue
You know how it is with an April day
When the sun is out and the wind is still,
You’re one month on in the middle of May.
from “Two Tramps in Mud Time” by Robert Frost
Appendix R
The steps to estimate the correlations and their bootstraps are:
- get the data
- align the series
- estimate
- plot
get the data
require(TTR)
ftselev <- getYahooData('^FTSE', 19800101, 20111118)
ftseclose <- drop(as.matrix(ftselev[, 'Close']))
n225lev <- getYahooData('^N225', 19800101, 20111118)
n225close <- drop(as.matrix(n225lev[, 'Close']))
align the series
Now that we have data, we need the two series to match up. We have two worries:
- ranges of dates may be different
- the two exchanges have different holidays
Is there a better way of dealing with the holiday issue than is done here?
n225ftsecom <- intersect(names(n225close), names(ftseclose))
n225ftseret <- diff(log(cbind(n225close[n225ftsecom], ftseclose[n225ftsecom])))
estimate
n225ftsecorb <- array(NA, c(10,3))
for(i in 1:10) n225ftsecorb[i,] <- pp.bootcor(pp.aggsum(n225ftseret, i))
The two custom functions are in pp.aggsum.R and pp.bootcor.R.
plot
The simple version of Figure 1 is:
matplot(1:10, n225ftsecorb * 100, type="l")

Hi Patrick! Good stuff — I didn’t realize you had co-authored a paper on this subject, thanks for providing the link. My default approach for dealing with daily asynchronous data is a Newey-West type of adjustment. Axioma now uses a vector autoregression that links global daily returns to lagged US returns, but I haven’t personally explored this method.
Hope all is well with you!
Randy,
Thanks.
An AR model is “wrong” according to Rob’s analysis, but it does essentially the same thing as an MA.
Pingback: Three things factor models do | Portfolio Probe | Generate random portfolios. Fund management software by Burns Statistics