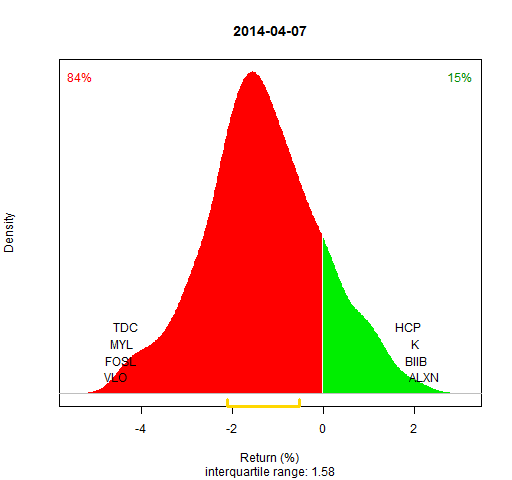
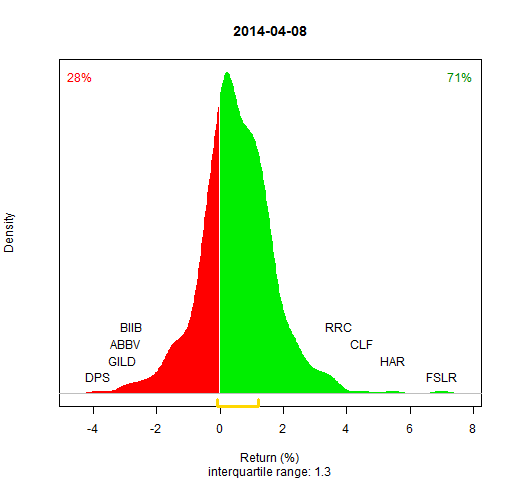
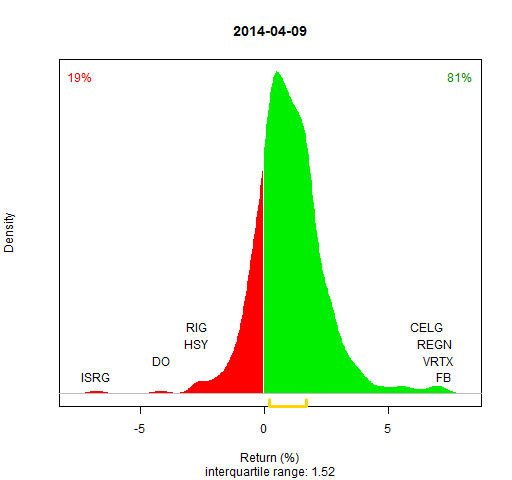
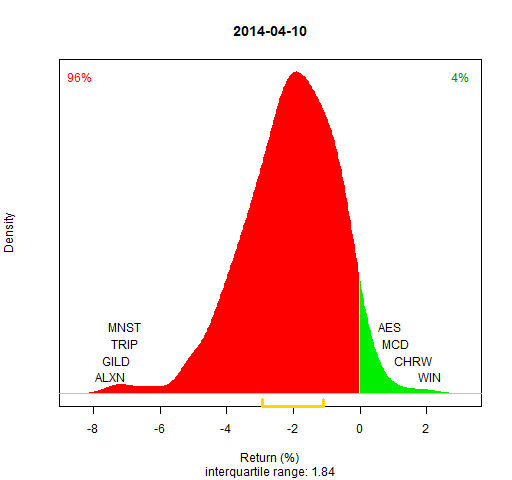
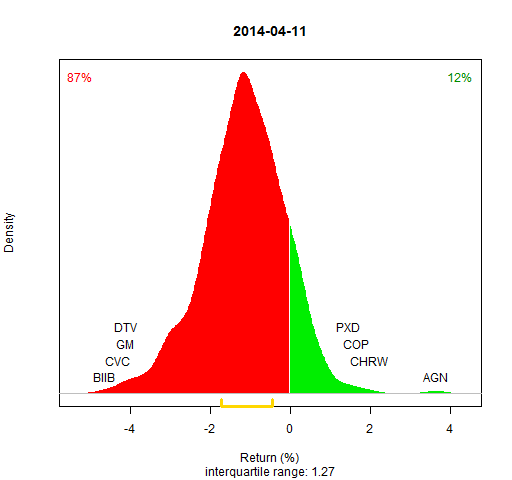
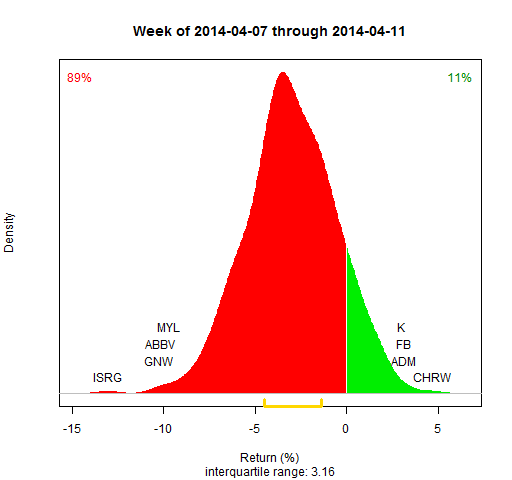
US large cap market returns.
Fine print
- The data are from Yahoo
- The S&P 500 stocks are used (as implied by S&P on 2014 January 11) that still survive with the same symbol
- The initial post was “Replacing market indices”
- The R code is in marketportrait_funs.R — you are free to use these functions however you like
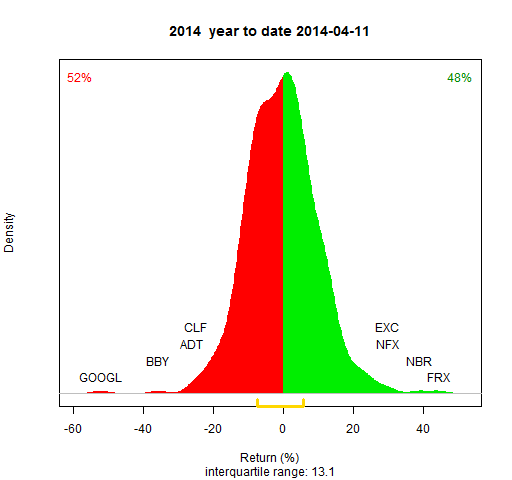

GOOGL in the YTD chart was not adjusted for the stock split. So, it is showing down 50% for the year.
Thanks. I’ll try to make GOOGL behave in future.
This is an example of how this sort of plot — for good and ill — is highly sensitive to data errors.